MLB Computer Picks Today: MLB AI Picks and Best F5 Bets for July 27, 2026
Today's MLB computer picks once again focus on the First Five Innings, where starting pitchers have the biggest influence on the outcome before bullpens enter the equation. Rather than trying to predict all nine innings, these MLB AI picks isolate the best early-game matchups by combining season-long offensive performance, recent form, handedness splits, expected pitching metrics, strikeout rates, and historical batter-versus-pitcher data.
The goal isn't simply to fade struggling pitchers or chase hot offenses. It's finding spots where multiple indicators point in the same direction, allowing us to target the market that best reflects the edge, whether that's a team total or a First Five side.

For bettors looking for additional daily forecasts across multiple sports, visit our latest AI betting predictions for data-driven betting insights and projections.
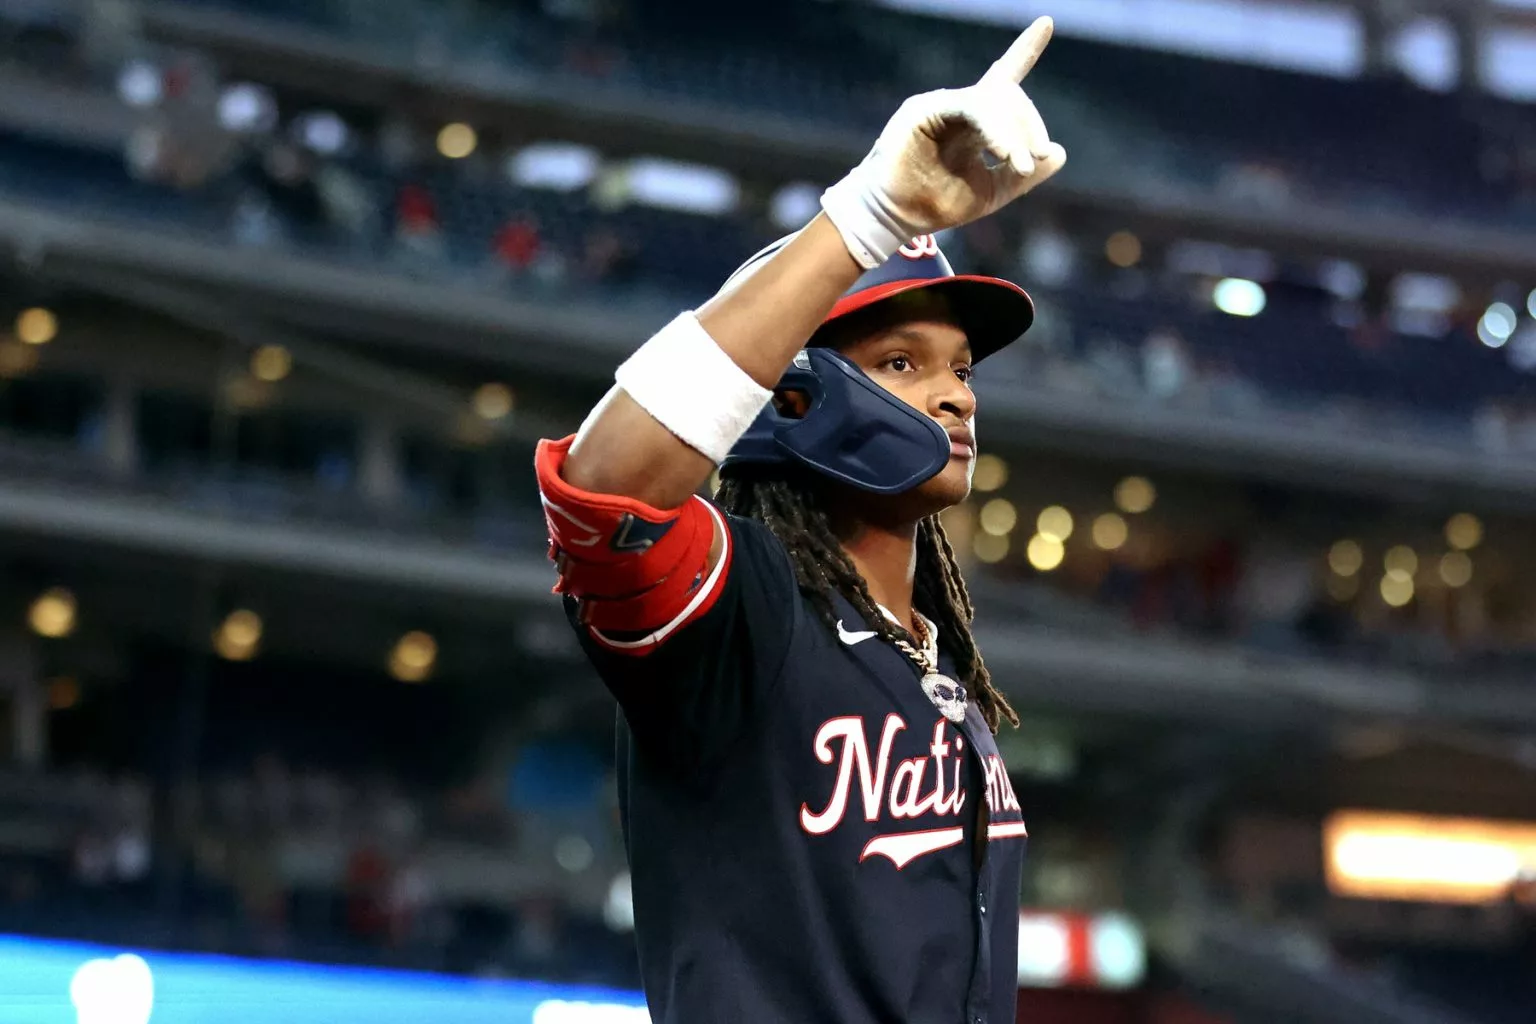
Nationals Team Total Over 2.5 Runs First Five Innings (-130)
Washington gets the top spot today because this isn't just a hot offense running into a shaky pitcher. It's one of the hottest offenses in baseball facing one of the weakest underlying pitching profiles on the slate.
Sign Up Get $30 Premium Picks Credit + Exclusive Offers
Subscribe Now
The Nationals have been swinging the bats at an elite level throughout July, and the production has been remarkably consistent.
Nationals Offensive Profile
Last 10 Days
- 157 wRC+ (Best in MLB)
- .404 wOBA
- .571 SLG
- 18 home runs
- 68 runs scored
July
- 152 wRC+
- .396 wOBA
- 19.2% strikeout rate
Season
- 112 wRC+
- .337 wOBA
- .447 SLG
- 156 home runs
- 584 runs scored
This isn't a lineup surviving on bloop hits or an inflated BABIP. Washington has been driving the baseball and producing power throughout the lineup.
The matchup against Max Scherzer only adds to the appeal.
Max Scherzer Key Metrics
Season
- 10.23 ERA
- 6.32 xERA
- 8.79 FIP
- 6.33 xFIP
- 5.73 K/9
- 4.50 BB/9
- 3.68 HR/9
The sample size is limited to six starts, but there's very little underneath the surface to suggest a turnaround is imminent. The strikeouts have disappeared, the walks have increased, and nearly four home runs allowed per nine innings is a dangerous recipe against a lineup producing this much power.
Current Nationals hitters have also handled Scherzer well:
- .323 batting average
- .393 wOBA
- .407 xwOBA
Rather than asking Washington to win the first five innings, the team total keeps the focus where the edge truly lies—the Nationals' offense.
Phillies F5 -0.5 (-130)
This is the cleanest starting pitching mismatch on today's board.
Unlike the Nationals play, this handicap is driven more by Zack Wheeler than Philadelphia's offense.
Zack Wheeler Key Metrics
Season
- 2.16 ERA
- 2.61 xERA
- 2.92 FIP
- 10.53 K/9
- 1.98 BB/9
Last Five Starts
- 2.27 ERA
- 1.81 xERA
- 1.69 FIP
- 13.64 K/9
- 1.14 BB/9
There simply aren't many weaknesses to attack. Wheeler has been dominant over a full season and has somehow been even better over the past month.
He's also enjoyed plenty of success against the current Marlins roster.
Wheeler vs. Miami
- .164 batting average allowed
- .209 wOBA
- .219 xwOBA
- 34.8% strikeout rate
Miami's offense has cooled considerably entering this matchup.
Marlins Offensive Profile
Last 10 Days
- 64 wRC+
- .267 wOBA
- .333 SLG
- 27.7% strikeout rate
Season
- 100 wRC+
- .320 wOBA
Philadelphia's offense isn't elite, but it has quietly improved.
Phillies Offensive Profile
Last 10 Days
- 106 wRC+
- .330 wOBA
- .445 SLG
Season
- 91 wRC+
Tyler Phillips has managed respectable surface numbers, but the underlying metrics remain concerning.
Tyler Phillips Key Metrics
Season
- 3.52 ERA
- 4.77 xERA
- 4.56 FIP
Last Five Starts
- 4.33 ERA
- 5.91 xERA
- 5.18 FIP
The Phillies don't need a huge offensive outburst here. With Wheeler on the mound, simply holding an early lead feels like the cleaner way to play the matchup.
Mets Team Total Over 2.5 Runs First Five Innings (+114)
The final play isn't built around a scorching offense. Instead, it's about buying into regression against a pitcher whose recent numbers have finally started matching the underlying metrics.
Martín Pérez has outperformed his expected numbers for much of the season, but that gap has begun closing quickly.
Martín Pérez Key Metrics
Season
- 3.38 ERA
- 4.58 xERA
- 4.45 FIP
- .237 BABIP
- 78.9% strand rate
Last Five Starts
- 5.71 ERA
- 7.16 xERA
- 7.32 FIP
- 6.75 BB/9
- 2.08 HR/9
The recent profile is one of the weakest on today's slate. Walks have climbed, home runs have followed, and his command has become increasingly inconsistent.
The Mets haven't been an elite offense this season, but there are signs of improvement.
Mets Offensive Profile
Last 10 Days
- 95 wRC+
- .306 wOBA
July
- 107 wRC+
Season
- 92 wRC+
The matchup history also stands out.
Mets vs. Martín Pérez
- .304 batting average
- .369 wOBA
- .367 xwOBA
- 144 career plate appearances
That's one of the largest batter-versus-pitcher samples on today's slate and suggests New York has consistently matched up well with Pérez's repertoire.
The Mets carry more volatility than Washington or Philadelphia, which makes the plus-money team total more appealing than laying juice on the First Five side. If Pérez's command issues continue, New York has a strong chance to push across three runs before the bullpens take over.
Never Tried Picks and Parlays? Now Is Your Chance
- Get your first daily picks package for ONLY $1 using coupon code BUCK
- If the pick loses, we credit your account with 3 Flex Picks
- If the pick wins, we still give you 1 Flex Pick on the house
- Win or lose, you walk away ahead. One dollar. No catch.

Up To $1500 in Bonus Bets Paid Back if your First Bet Does Not Win

New Users – Get $350 in Bonus Bets when you wager $5 for 7 days

New DraftKings Customers: Bet $5, Get $200 + 3 Months of NBA League Pass!