MLB Computer Picks Today: MLB AI Picks and Best F5 Bets for June 19, 2026
The MLB computer picks model continues to generate profitable results by focusing on one of the most predictable edges in baseball betting: starting pitching versus offense during the first five innings.
Unlike traditional full-game handicapping, these MLB AI picks are designed to eliminate bullpen volatility, inherited runners, and late-game managerial decisions. The model isolates starter quality, offensive production, recent form, strikeout rates, power metrics, and expected run prevention to create cleaner projections before relievers ever enter the game.

For bettors looking for additional daily forecasts across multiple sports, be sure to check out our latest AI betting picks for data-driven betting insights and projections.
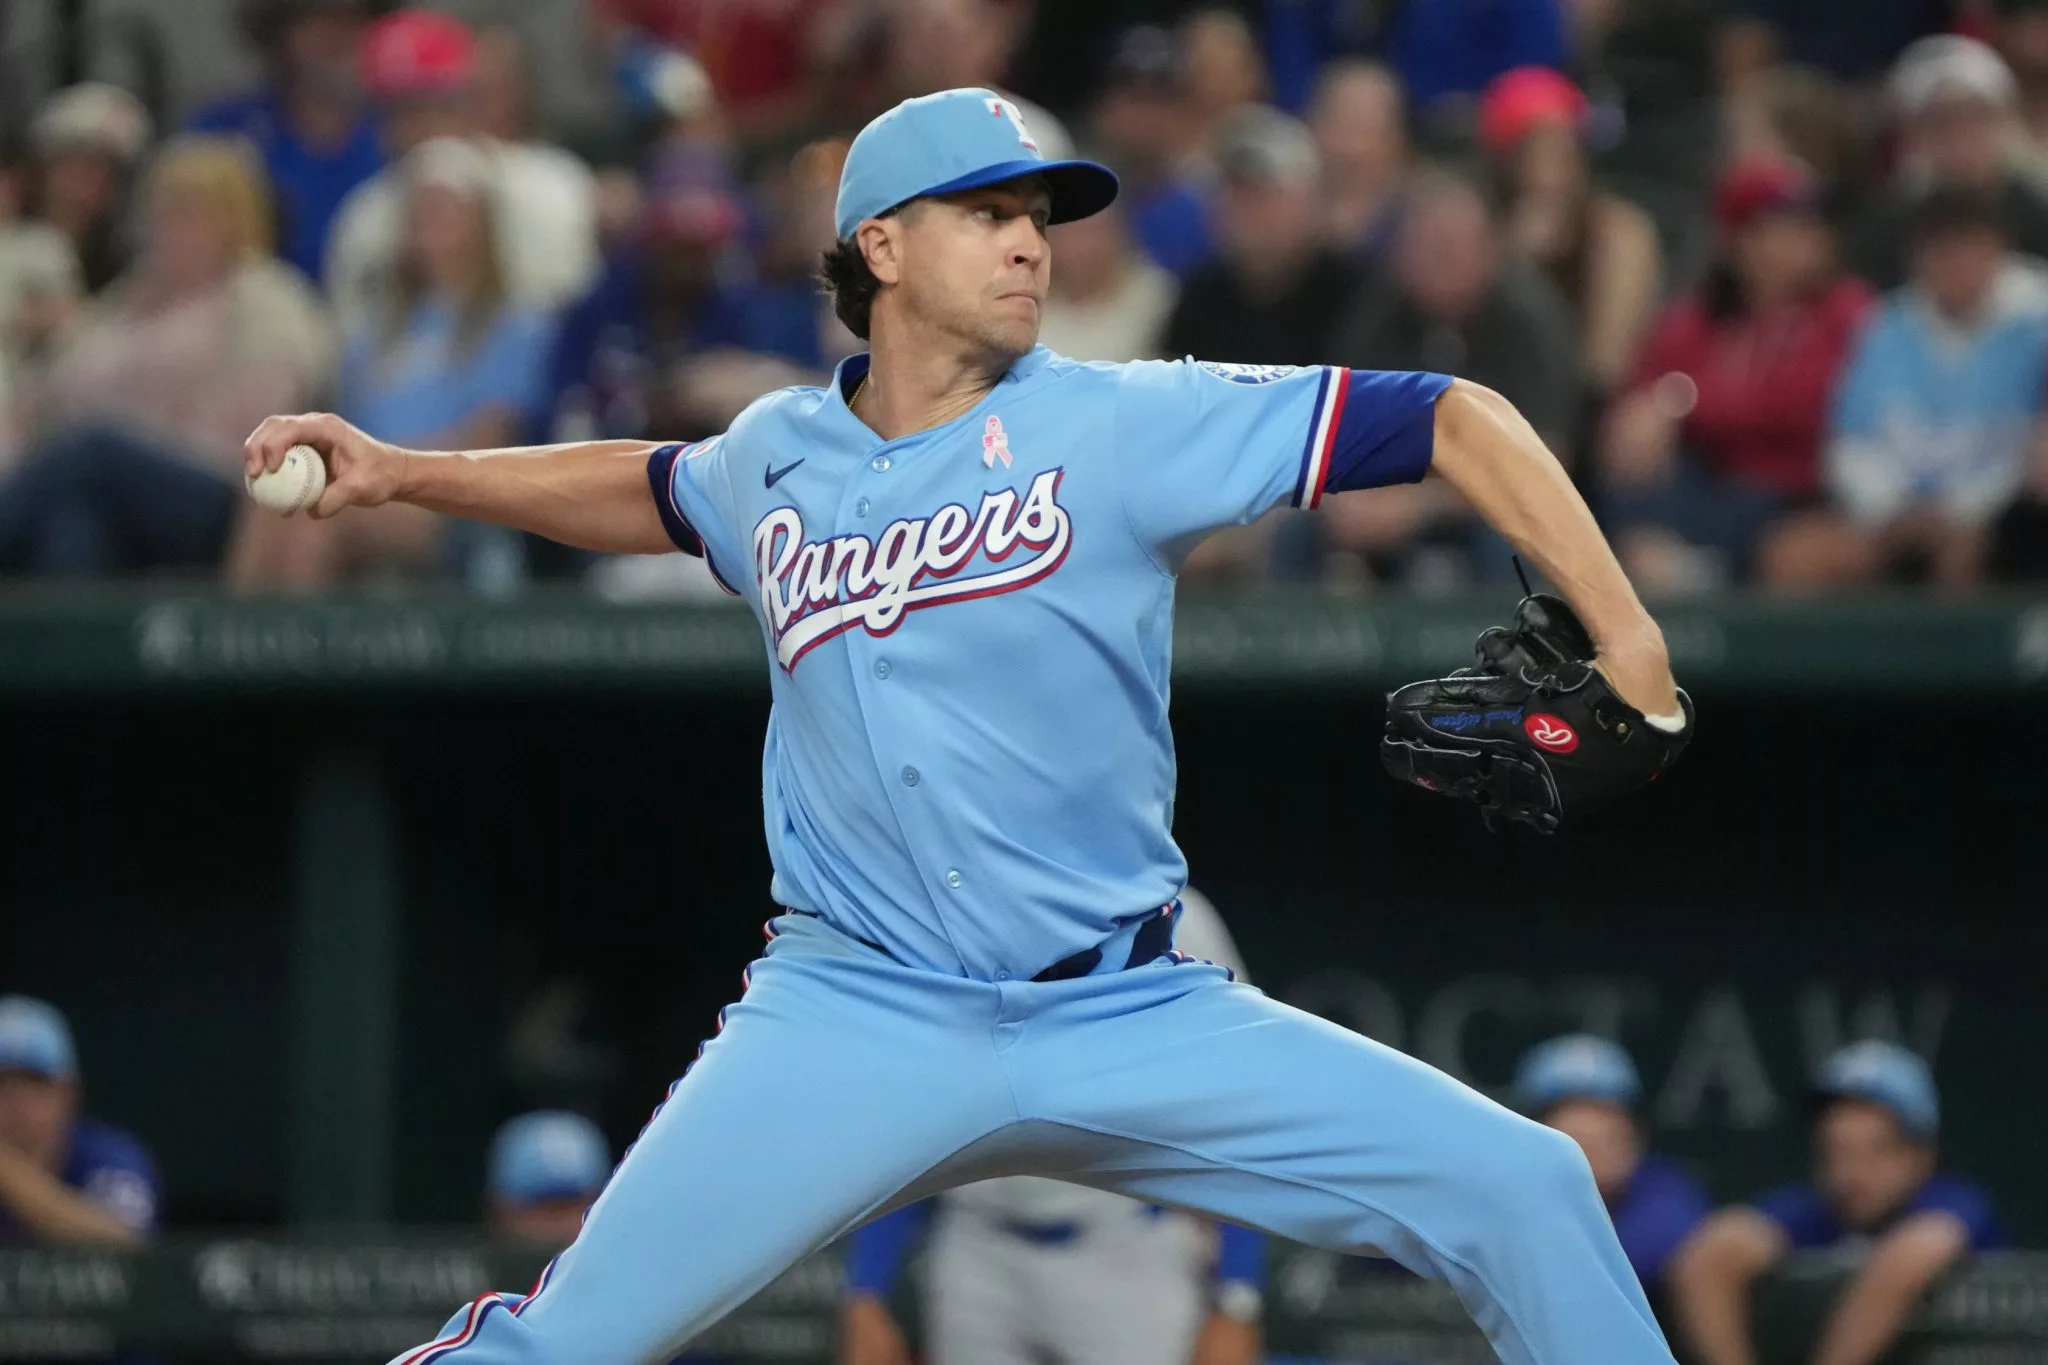
Rangers F5 -0.5 (-130)
This is the strongest overall side available today.
Sign Up Get $30 Premium Picks Credit + Exclusive Offers
Subscribe Now
The model projects Texas to lead 3.03 to 1.60 through five innings, creating the largest projected margin on the slate.
The matchup starts with Randy Vásquez, who has become one of the most attackable pitchers in baseball despite occasionally posting respectable surface results.
Randy Vásquez Recent Profile
- 6.26 xERA
- 4.47 FIP
- 1.33 HR/9
Over the last 30 days:
- 5.63 ERA
- 9.60 xERA
- 6.93 FIP
- 2.63 HR/9
The recent numbers are particularly alarming. Vásquez has struggled to miss bats, allowed increasing hard contact, and continues to show significant home-run vulnerability.
Texas has quietly improved offensively as the season has progressed.
Rangers Offensive Profile
Season
- 97 wRC+
Last 30 Days
- 108 wRC+
Last 14 Days
- 103 wRC+
The offense isn't elite, but it doesn't need to be against a pitcher carrying this type of underlying profile.
The second half of the handicap is Jacob deGrom.
Jacob deGrom vs Padres
San Diego remains one of the weakest offenses in baseball.
Padres Offensive Metrics
- 85 wRC+ on the season
- 86 wRC+ vs right-handed pitching
- 80 wRC+ over the last 30 days
- 84 wRC+ over the last 14 days
Meanwhile, deGrom continues to perform at an extremely high level:
- 3.56 xERA
- 10.45 K/9
- 1.76 BB/9
Current Padres hitters have also struggled badly against him historically:
- .211 batting average
- .223 wOBA
- 31.7% strikeout rate
The combination of Texas facing one of the weakest starters on the board and San Diego facing one of the best creates the strongest projected First Five edge available.
Brewers F5 -0.5 (-130)
Milwaukee enters Friday as arguably the hottest offense in baseball.
The Brewers have been excellent all season, but their recent production has elevated them into another tier entirely.
Brewers Offensive Profile
Season
- 107 wRC+
Last 30 Days
- 121 wRC+
Last 14 Days
- 145 wRC+
During the past two weeks, Milwaukee has produced:
- .382 wOBA
- .520 slugging percentage
- 26 home runs
- 91 runs scored
The matchup against Martin Perez looks favorable despite his respectable ERA.
Martin Perez Profile
- 2.90 ERA
- 4.02 xERA
- 3.82 FIP
- 7.4 K/9
- 3.05 BB/9
Perez relies heavily on contact management and lacks the swing-and-miss profile typically needed to navigate a lineup producing this much power.
The matchup history also favors Milwaukee.
Brewers vs Perez
- .299 batting average
- .408 wOBA
- .374 xwOBA
On the other side sits Jacob Misiorowski, who has rapidly become one of baseball's most dominant young arms.
Jacob Misiorowski Profile
Season
- 1.34 ERA
- 2.04 xERA
- 1.68 FIP
- 13.55 K/9
- 0.41 HR/9
Last 30 Days
- 0.25 ERA
- 1.36 xERA
- 0.84 FIP
- 12.75 K/9
- 0 HR allowed
Atlanta's offense has cooled dramatically.
Braves Offensive Profile
Season
- 105 wRC+
Last 30 Days
- 94 wRC+
Last 14 Days
- 77 wRC+
That recent decline combined with Misiorowski's dominance creates a significant early-game edge for Milwaukee.
Rockies Team Total Under 2.5 Runs (+100)
This may be the most misunderstood play on today's board.
Most bettors immediately see Coors Field and assume offense. The model does not automatically inflate projections because of the venue. Instead, it projects the matchup first and simply notes that volatility is elevated.
Colorado's offense has improved recently but remains below average over the full season.
Rockies Offensive Profile
Season
- 90 wRC+
Vs Right-Handed Pitching
- 96 wRC+
Last 30 Days
- 101 wRC+
Last 14 Days
- 124 wRC+
The recent surge is real, but the season-long numbers still matter heavily in the projection process.
The key to the play is Bubba Chandler.
Bubba Chandler Profile
Season
- 4.19 xERA
- 4.52 FIP
- 9.0 K/9
Recent Form
- 2.98 xERA
- 2.40 FIP
- 11.08 K/9
- 0.35 HR/9
His strikeout ability has improved substantially while simultaneously limiting home-run damage.
Even accounting for Coors Field, the model projects Colorado for only about 2.05 runs through five innings.
The biggest risk isn't Chandler. It's Coors Field itself. One walk sequence, one wind-aided fly ball, or one defensive mistake can quickly change the outlook. Still, the projection remains comfortably below the market expectation.
Never Tried Picks and Parlays? Now Is Your Chance
- Get your first daily picks package for ONLY $1 using coupon code BUCK
- If the pick loses, we credit your account with 3 Flex Picks
- If the pick wins, we still give you 1 Flex Pick on the house
- Win or lose, you walk away ahead. One dollar. No catch.

Up To $1500 in Bonus Bets Paid Back if your First Bet Does Not Win

New Users – Get $250 in Bonus Bets when you wager $5 for 5 days

New DraftKings Customers: Spend $5+ Get $150 in Bonuses